ergmx#
Exponential-family random graph models (ERGMs) in Python, with a Rust core.
ergmx fits, simulates and checks ERGMs with a high-level API in the spirit
of R’s ergm and statnet: R-style formulas,
the same terms and statistics, and summary(), gof() and
mcmc_diagnostics() that read like R’s. Its MCMC sampler is written in Rust
and runs chains in parallel threads, so fits take seconds.
Note
ergmx has 167 terms and 9 operators for directed, undirected and bipartite
networks, and interactions; curved ERGMs, sample space constraints, missing
ties, multilevel networks (as MPNet), samples of networks (as ergm.multi),
temporal ERGMs, EGMME and dynamic simulation (as tergm), MPLE, contrastive
divergence and Monte Carlo MLE, MCMC diagnostics, log-likelihoods, model
comparison, goodness of fit, tie probabilities, marginal effects and tables
of results, for networks of up to tens of thousands of vertices, all
validated against R.
A first look#
faux.mesa.high is a friendship network of 205 high school students. Do
students befriend others of the same grade and race, and friends of their
friends?
import ergmx
from ergmx import datasets

mesa = datasets.load("faux.mesa.high")   # an igraph.Graph

fit = ergmx.ergm(
    mesa,
    "edges + nodefactor('Sex') + nodematch('Grade') + nodematch('Race') + gwesp(0.5, fixed=TRUE)",
    seed=1,
)
fit.summary()
Monte Carlo Maximum Likelihood Results:

                   Estimate  Std. Error  MCMC %  z value  Pr(>|z|)
edges               -6.1846      0.1734       0  -35.669    <1e-04 ***
nodefactor.Sex.M    -0.1256      0.0747       0   -1.681   0.09274 .
nodematch.Grade      1.9710      0.1758       0   11.210    <1e-04 ***
nodematch.Race       0.2657      0.1188       0    2.235   0.02539 *
gwesp.fixed.0.5      1.2166      0.0853       0   14.271    <1e-04 ***
---
Signif. codes:  0 '***' 0.001 '**' 0.01 '*' 0.05 '.' 0.1 ' ' 1

Log-likelihood: -867.1531 (MC SE 0.194)   AIC: 1744.3062   BIC: 1784.0461
Converged after 6 iterations (4 chains, 1024 samples).
Same-grade friendships are much more likely than others (the
nodematch.Grade coefficient), and so are ties that close triangles
(gwesp). R’s ergm gives the same estimates. Then check that the model
reproduces the network’s structure:
fit.gof(seed=1).plot();
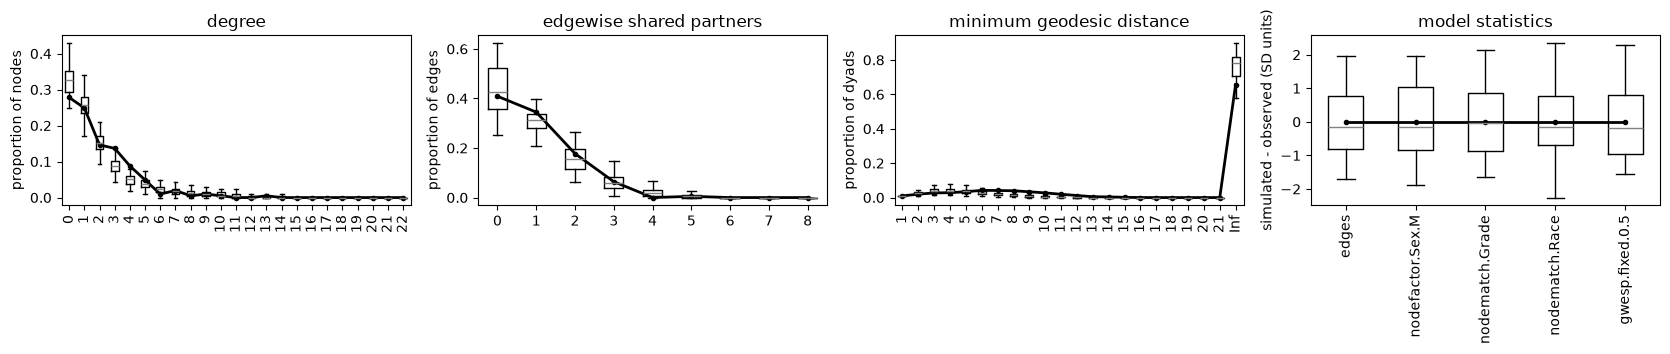
The black lines are the observed network’s distributions and the boxplots those of 100 networks simulated from the model.
Two complete analyses, from the data to a table of results: an ERGM and a multilevel ERGM.
Networks, formulas, fitting, curved models, constraints, missing ties, multilevel and bipartite networks, samples of networks, networks over time, diagnostics, goodness of fit, model comparison, interpreting and reporting results, simulation, and saving fits.
The 167 terms and 9 operators, their statistics and their names.
Every function and class, its parameters and what it returns.
ergm and statnet functions and their ergmx equivalents.
How ergmx’s results compare with R’s ergm, and how fast it is.
What changed in each version.